
One of the recent developments within the NHL Analytics community has been the discovery and application of the GAR (Goals Above Replacement) statistic. This is based on WAR (Wins Above Replacement) which has yielded fruitful results for Major League Baseball. This is the first attempt at capturing the value of a player in a single measurement, which can then be used to compare the relative performance of players on different teams.
What is GAR?
GAR is a measurement of an individuals’ goal contribution to the team, relative to a replacement-level player. The logic is that you need a positive goal differential in order to win hockey games, therefore you need players that can generate offense and/or be responsible defensively. Replacement-level players refers to your average replacement option – low salary free agents or AHL call-ups. Players with a positive GAR are better goal contributors than a replacement player. Players with a negative GAR are worse goal contributors than a replacement player.
How is GAR Calculated?
There are six different dimensions that are used to determine GAR:
EVO – Even Strength Offense
EVD – Even Strength Defense
PPO – Power Play Offense
Draw – Penalties Drawn
Take – Penalties Taken
FAC – Faceoffs
EVO, EVD and PPO data is generated through an adjusted plus-minus system (XPM) and box plus-minus system (BPM). XPM is the value of how much influence a player has on their team’s expected goals (https://hockey-graphs.com/2016/10/25/expected-plus-minus/). BPM is generated through box score statistics that estimate their performance relative to replacement level (https://hockey-graphs.com/2016/10/26/introducing-box-plus-minus/).
How does everyone stack up?
The summary statistics of the overall dataset (2016-2017):
890 observations
Range: -4.7 – 24.6
Mean GAR = 3.18
Median GAR = 1.6
Limiting the scope to players with 1000 minutes last year (12ish per game) yields the following summary statistics:
379 observations
Range: -3.8 – 24.6
Mean GAR: 6.4
Median GAR: 6.2
When looking at full-time NHL starters, half of players had a GAR score higher than 6.2; Those with a GAR score higher than 9 were in the top 25%; Those with a GAR score higher than 13.8 were in the top 5%. This means that players in the top 5% are responsible for at least 13.8 goals more than a replacement player over the course of the season. With this statistic, we can look at the top players in each role (F or D):
Top Forwards
Top Defensemen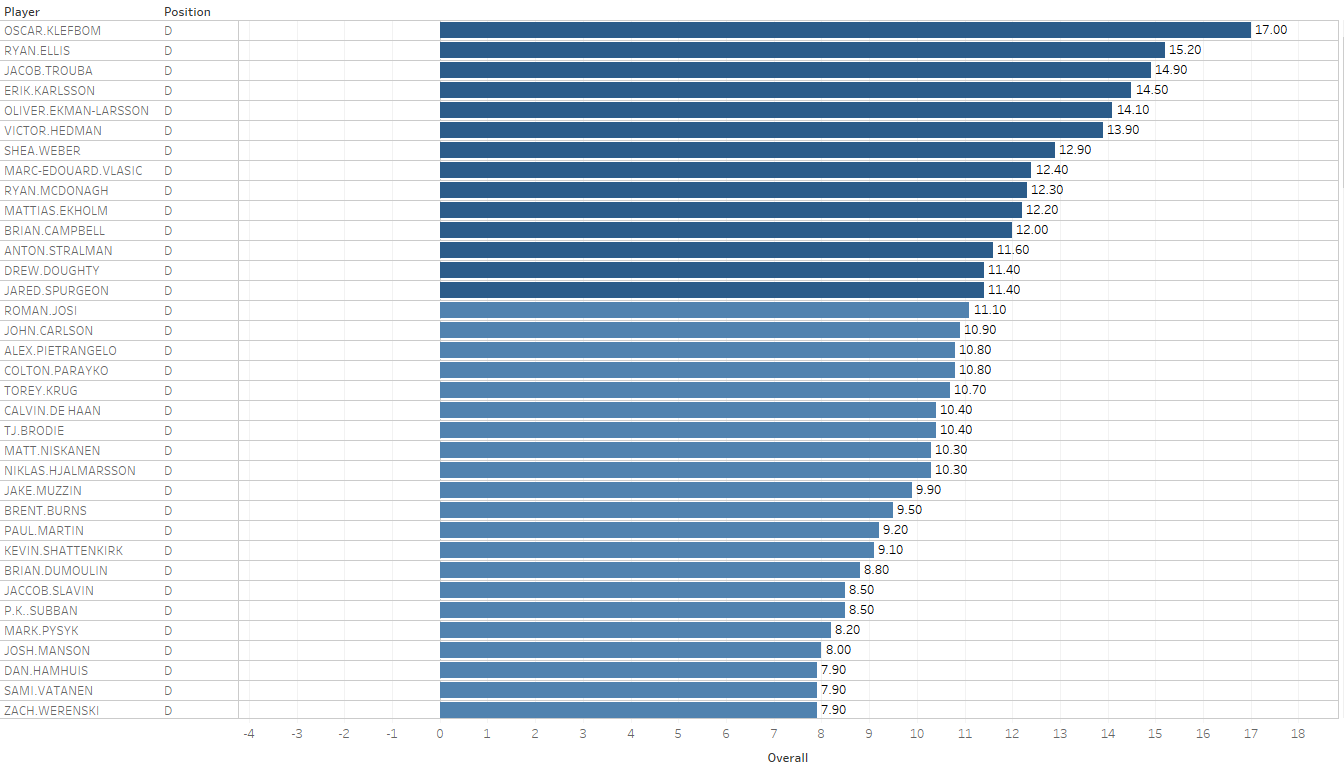
You can find the full visualization HERE
What can we do with it?
GAR has demonstrated to be a more significant indicator of wins, explaining 72% of the variation (https://canucksarmy.com/2015/08/17/how-to-build-a-contender-part-1-war-what-is-it-good-for/). Compared to Corsi, which only explains 38% of wins. This is significant progression over the past decade in the advancement of hockey analytics. However, it should be noted that GAR is neither a perfect measurement of player contributions or team success. Even as the most powerful indicator of team success, 28% of the variation still remains in the error term. This may include intangibles (e.g. leadership, veteran presence, etc), which are not accounted for in this model. That being said, I’m going to use this statistic to determine player value based on their respective contracts.
In doing so, you can cross-reference the GAR score with annual cap hit values. For this graph, only players with greater than 6 GAR are included and McDavid has been removed because he is such an outlier (spoiler alert: He is 8 GAR ahead of 2nd place Crosby). The average GAR costs 500k, which means that a player making $5 million should produce approximately 10 GAR in order to be paid fair market value. Players that are shaded red are paid 25% more than fair market value, based on their performance last year. Players shaded blue are paid 25% less than fair market value, based on their performance last year.
2016-2017 GAR values (>6) and 2017-2018 AAV – Forwards
2016-2017 GAR values (>6) and 2017-2018 AAV – Defensemen
In sorting through the players with the greatest bang for their buck, I have constructed the 2016-2017 All-Moneyball team. In doing so, I have not included any starting players on ELC (one total – a backup goaltender). It would have been much easier to include a host of young and cheap talent (including Matthews, Tkachuk, Laine, Marner, and Rantanen). While these players offer immense value at this point in their careers, they also represent a small sample size.
2016-2017 All-Moneypuck Team
All of these players represent a massive value based on their current contracts. The worst value on the team, Sean Couturier, performed at the level of someone making 1.5 million more. In terms of GAR, both Jamie Benn and Sean Couturier performed nearly identically (10.4;10.3), but Benn is making 5 million dollars more. One of the things you may notice from the roster is the lack of any top paid player. The most expensive player is Erik Karlsson at 6.5m, Filip Forsberg at 6m, Blake Wheeler at 5.6m and John Tavares at 5.5m with no others above 5 million. This is not the All-Star roster, but the All-Value roster. Because top-end talent costs top-end money, it would be impossible to field a team of multiple all-stars. The benefit of spreading money across the top 3-lines is that injuries, in-game match-ups, suspensions and other unforeseen events will be easier to manage.
In conclusion, the GAR statistic offers a more comprehensive statistic for understanding the tangible values of players, based on their performance on the ice. It does not take into account intangible factors, including leadership and momentum swings, which are known to be integral to the success or failure of a franchise. What GAR does offer is an unbiased analysis of on-ice contribution relative to other players. In a salary-cap league, it is a competitive advantage to pay less money for similar performance.
