
It’s the week before the Super Bowl and that means that fantasy football has been concluded for over a month. The spell has been broken on the cyclical ritual of getting amped about your roster and then massively disappointed after the 1 o’clock games. The off-season gives us the chance to reflect on the good and bad decisions made throughout the course of the season.
If you have managed a fantasy football for multiple years, the off-season gives you a chance to contemplate any tweaks that need to be done to league scoring. I have long thought about changing from standard scoring to PPR, but it was a concern about what it would do to alter the weights of each position. For fantasy football aficionados, the PPR vs. standard scoring remains a point of contention, in which both sides are stalwart in their defense of their scoring preference. For those less familiar with this debate, there are a few important key points.
Standard fantasy football scoring is the set of default scoring preferences used by popular fantasy football platforms, such as ESPN, NFL.com and CBS. Typical default settings look something like this:
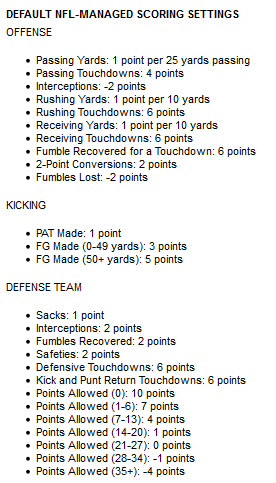
Source: http://www.nfl.com/fantasyfootball/help/nfl-scoringsettings
You can see from the above image that default scoring awards points to TEs, WRs and RBs based on the number on rushing yards, receiving yards and most importantly, touchdowns. For standard scoring leagues, these are the key variables for maximizing points and winning. PPR leagues use the same scoring as the standard scoring listed above with the exception of awarding Points Per Reception or PPR. There are several different variations to the scoring used, but generally either 0.5 (Half) or 1.0 point is awarded per reception. This obviously has a large impact on fantasy scoring because TEs, WRs and RBs who catch passes are awarded additional points. This also has an impact on the relative nature of fantasy football, because while it awards additional points to those three positions, it does not award anything to QBs. I do not wish to take sides, but rather present the data for each system: Standard scoring, Half-PPR and PPR.
I searched the internet to try and find some information on how this translates to more/less scoring for players to no avail. Alas, that is no longer an issue:
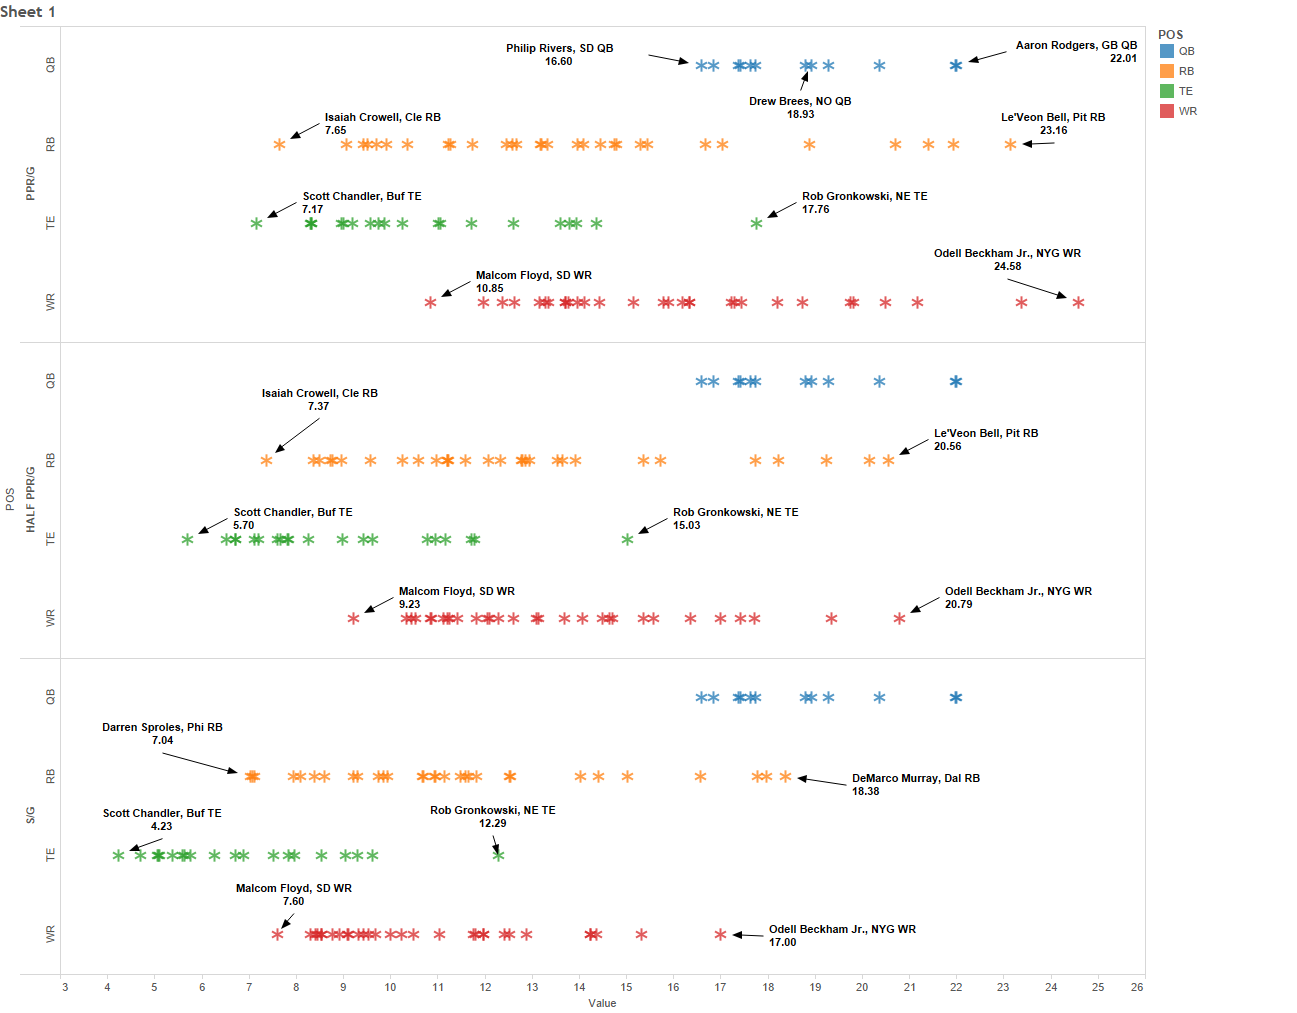
Link: https://public.tableausoftware.com/views/PPRHalfandStandardFantasyFootballScoring/Sheet1
I took a sample of the ‘most likely to be on a roster’ (assuming that it is a 10 person league). This included 12 QBs, 30 RBs and 30 WRs and 20 TEs (in case you do a superflex). In order to remove the noise associated with injuries, I use average points per game played (Total points/games played).
As you can see, receptions greatly increase the value of WRs and some RBs, while keeping QBs constant. Another thing about PPR and Half PPR is that it makes the rich only get richer. Awesome players, such as Odell Beckham Jr. and Le’Veon Bell, receive a much larger benefit than their less awesome counterparts. This is in part because receptions contribute to a large amount of their total yardage and touchdowns. At the same time, more irrelevant players (in relative terms), such as Darren Sproles and Shane Vereen, become more lucrative.
I am not suggesting that one scoring system is better than the others. Much has to do with the emphasis that a league manager wants to put on certain players and football actions.
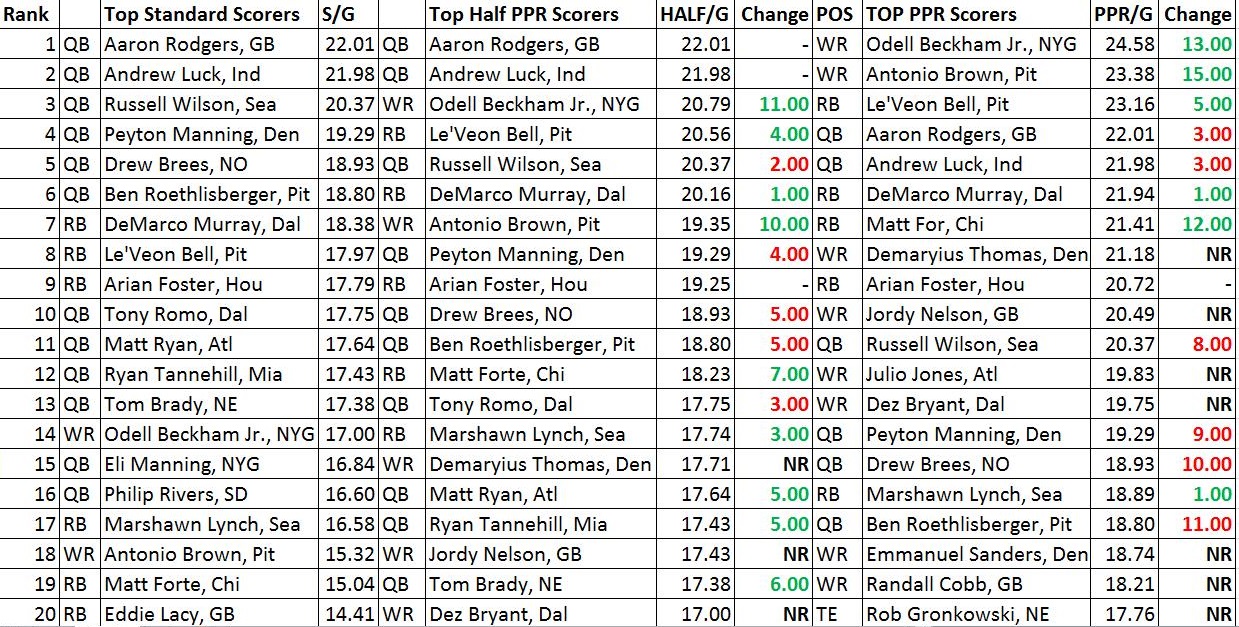
Edit (1/30/2015):
I wanted to present this information in another way, so I have listed the top 20 scorers for each format, along with the rank change from standard scoring to the PPR-based scoring systems:
Another way of visualizing this is the looking at the increase in points/week when Half or PPR are taken into consideration. I have listed the top 50 players, in order of how many additional points/week they receive for receptions below.

Last, but certainly not least, I did a percentage of points from reception points. This illustrates to what degree receptions increases the total number of points each player gets per week. What is interesting is that the greatest percentage bump is for tight ends (who were ranked outside of the top 50 in standard scoring formats), which is based on the fact that they may not generate as many yards and TDs, but still get a consistent amount of receptions per game. The same can be said about Edelman, Tate and White, who seem to come out of obscurity to crack the top 40, making them PPR gems.

