
This is the first part of many posts that is part of a larger project. The ultimate goal of this project is to develop a statistical model that will allow me to determine the probability of wins and losses for NHL teams. I am hesitant to say that I will be able to predict who will win or lose, but rather construct a model for success (i.e. if certain conditions are met, a team is more likely to win). As hockey fans, we recognize certain events during games that alter the momentum of one team. The model that I am developing is an attempt to capture important aspects of the game, such as shooting the puck or winning faceoffs. The data is sourced from war-on-ice.com, and has been organized per team by game spanning from 2005-2014 (totaling over 25,000 rows). As of right now, I expect to examine several game situations including but not limited to: even strength, power play, shorthanded and 4v4.
The first order of business is examining even strength goals. I think that everyone can agree that the absence of 5v5 scoring diminishes the ability of a team to be competitive. Along with goals against, scoring goals is one of the most important events that occur during a hockey game. Recently, the most common explanation for goal scoring is puck possession. It has been theorized that teams with high puck possession rankings tend to be more successful. This seems intuitively true, since the team who possesses the puck has more chances at scoring than the team without the puck. Since there is only one puck on the ice, it is a zero-sum game: whoever doesn’t have the puck cannot score. The two most common measurements of puck possession are Fenwick and Corsi. In simple terms, Corsi measures all shots taken, whether they miss the net, blocked, or on net. Fenwick also measures shots taken, with the exception of those blocked.
In other words:
Corsi = All shots directed toward the net
Fenwick = All shots directed toward the net – Blocked shots
This distinction is important for the analysis, because both of these measurements are going to be examined with respect to goal scoring. In order to examine the relationship between goal scoring and puck possession, I use team Corsi For and Fenwick For, which only measure the number of shots from the offensive team. For example on 3/26/2015, the Toronto Maple Leafs registered a Fenwick For (FF) of 37 and Corsi For (CF) of 50, which means that 13 of their shots directed toward the net were blocked. In other words, since possession of the puck is a necessary condition of increasing FF or CF, it would seem that the Leafs had good puck possession during the game. On the other hand, this can be misleading because their Fenwick Against (FA) and Corsi Against (CA) were greater than FF and CF. In other words, even though they had 50 shots miss the net, hit the net, be blocked or saved, they gave up greater than 50 shots on their own net.
In order to test this claim, I ran several bivariate OLS regression models using STATA. In this particular case, I examine the even strength goals for as the dependent variable and the even strength Corsi for % as the single independent variable. In short, it provides no explanatory power with respect to goal scoring. I could show the output for Fenwick for % as well, but both are dreadful at explaining the variation in goals scored. In other words, goal scoring (a necessary requirement to win a game) does not appear to be causally related to the commonly used indicators of puck possession.
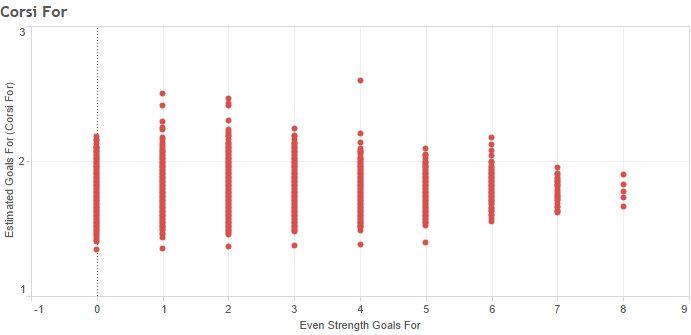
In order to illustrate the relationship between FF/CF and even strength scoring, I create an estimator based on their Fenwick For and Corsi For. I have plotted the estimated number of even strength goals that a team will score based upon their Fenwick and Corsi. The other axis measures the actual number of goals that the team scored. As you can see from the first set of graphs below, the estimator based on number of shots (whether blocked or not) does not seem to be a good predictor for goal scoring.

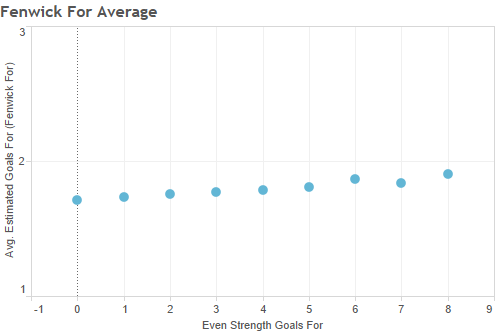
When the total number of estimated goals for, based on Fenwick and Corsi, are averaged it appears to trend in an upward direction. In other words, there is a positive relationship between Fenwick and Corsi. The problem is that it is a poor indicator of explaining why teams score more or less. The amount of variation is small, ranging from 1.7 to 1.9, while the actual number of goals scored ranges from 0 to 8.

Not to beat a dead horse, but the last analysis is based on 60 minutes of even strength time. Both the Corsi/Fenwick and actual goals scored are based on 60 minute even strength time. While the results are more significant, and trend in a more robust upward direction, the estimated values based on the team Corsi and Fenwick are not accurately predicting the actual number of goals that the team scores.


I would like to introduce another way of measuring offensive success that takes into account several other aspects that occur during hockey games. In order to achieve this goal, I include the following events: Faceoff percentage, percentage of faceoffs in the offensive zone, team shooting percentage, team blocked shots and team hits. I posit that each of these variables plays a strong role in puck possession. Events such as hits, blocked shots and faceoff wins can be advantageous for possession. Furthermore, shooting the puck well is a much bigger factor in goal scoring than shooting the puck. While it is conventional hockey wisdom that there ‘is never a bad shot’, missing the net might as well be a turnover. In case you were wondering about the relationship between shooting percentage and number of shots, there is actually a negative correlation.
Surprisingly, there is a negative relationship between shooting percentage and both CF and FF. It can be interpreted that shooting the puck unnecessarily actual lowers shooting percentage. This is seemingly common sense, since taking low percentage shots lower the teams shooting percentage. This supports the idea that Corsi and Fenwick may not be the best measurement for goal scoring. If the logic behind the use of this measurement is that puck possession can be measured through shot attempts, there are serious questions whether this translates to goals.
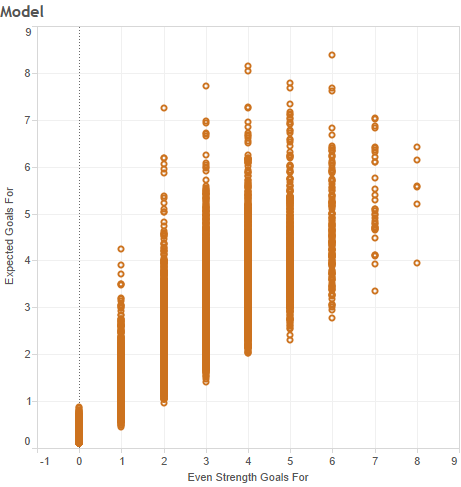
Based on the factors I mentioned above, including shooting percentage, hits, faceoff winning percentage and zone starts, I have constructed a model that better encapsulates what contributes to goal scoring. The following graphs illustrate the expected goals for and the average of all games with the actual number of goals scored by the team in those games. I have also included a graph with the averages of these estimated values, which is relatively accurate when compared to the actual number of goals scored. While the model performs well with teams that scored less than 5 even strength goals, it does not account for variation in high scoring games. Keep in mind that 97% of all teams since 2005 scored 4 or less even strength goals. That means that only 3% of all games in the past decade are less than adequately explained using this model.

I do not contend that I have found a secret to success in the NHL, but rather have applied knowledge of the game and operationalized these concepts through the appropriate variables. In doing so, the statistics confirm many of the cliches that hockey analysts and coaches attribute to team success. There is little doubt that success is rooted in having strong centers, or wings that can assist on draws, coupled with time in the offensive zone, shooters that are more selective about taking shots, blocking shots and finishing checks. The use of puck possession indicators, such as Fenwick and Corsi have been touted as strongly predictive measures of team success. While teams with relatively high Corsi for % and Fenwick for % have demonstrated success, there are underlying factors that contribute to winning games which extend beyond shots.
