
Following up from the previous post here, which examined the best (and worst) GAR performers in each game situation, this article will examine defensemen value relative to cap hit. For more information on how GAR is calculated, please check out the introduction. Before delving into the nuances of player value, I present an illustration of the cap hit and GAR of all defensemen:
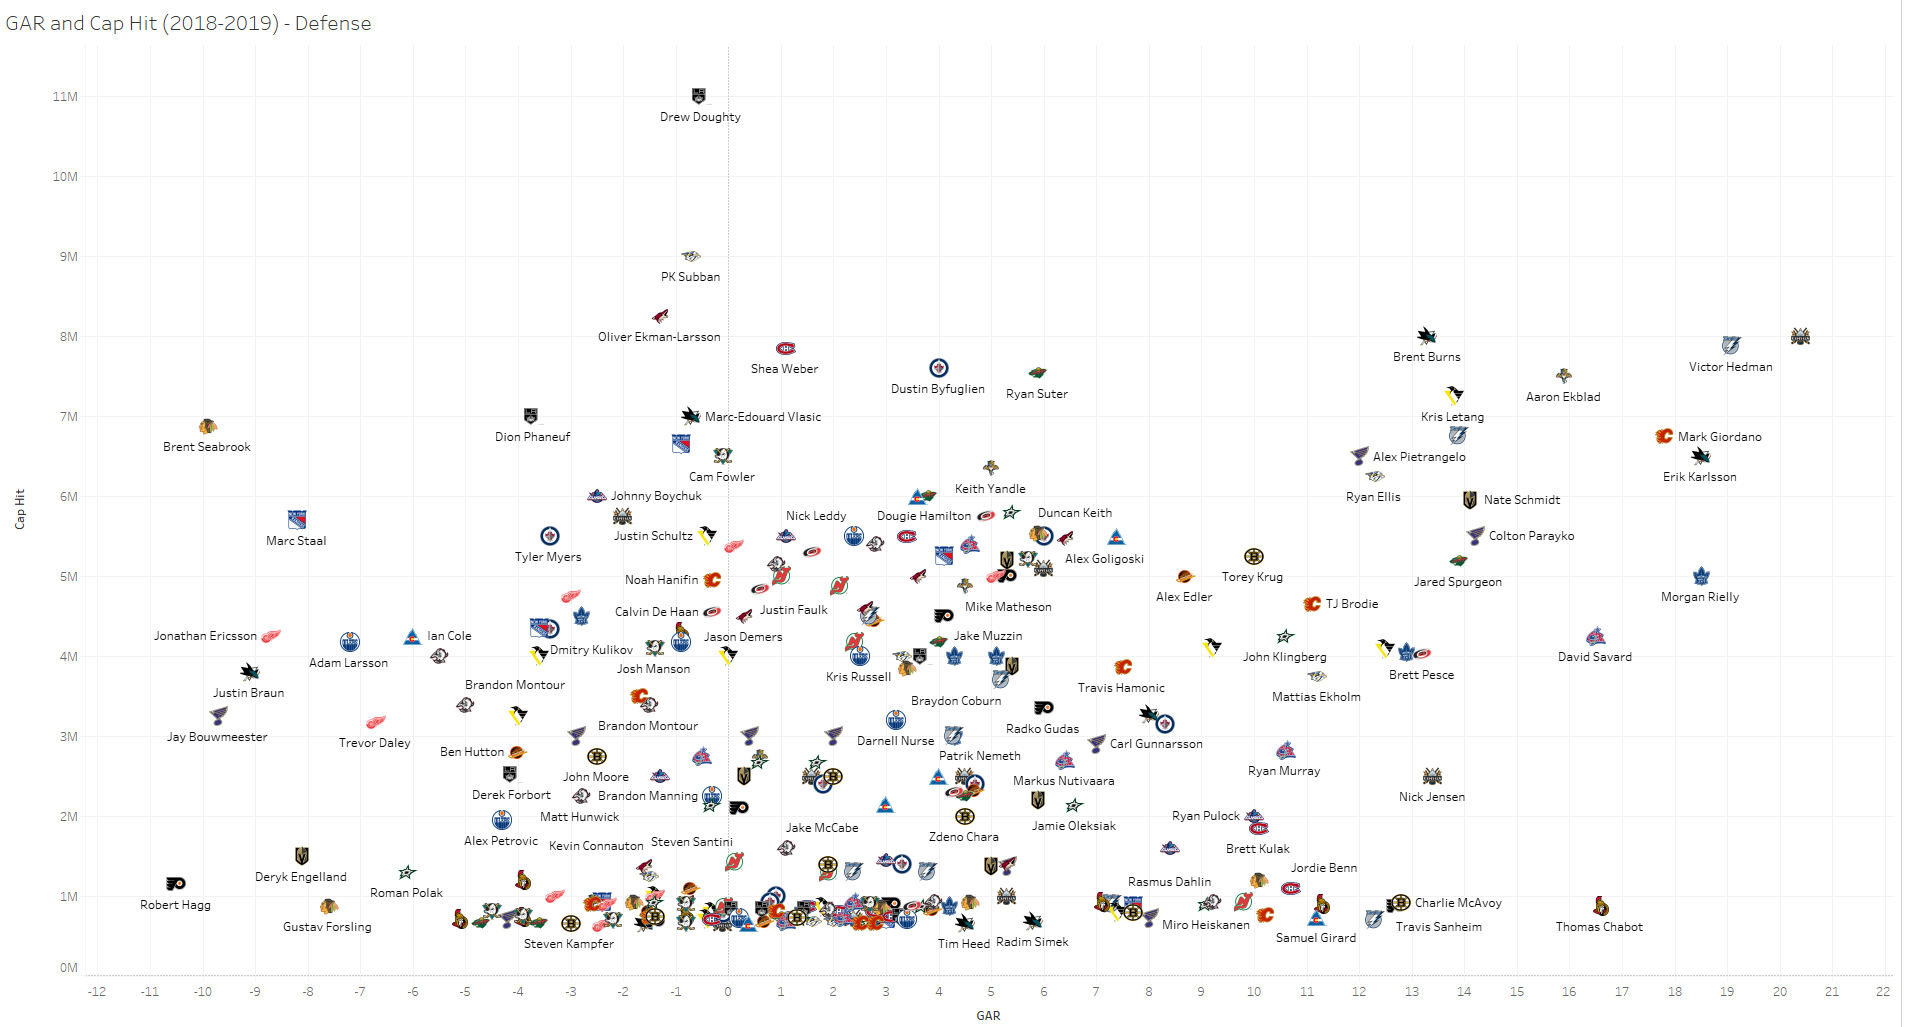
It is not surprising to see many defensemen currently on entry-level contracts performing overwhelmingly well in terms of value (such as Chabot, McAvoy and Girard). One can expect that those three players in particular will get paid top-dollar on their next contracts.
Moving on, the next series of graphs will utilize GAR/$, calculated by dividing GAR by AAV of their 2018-19 contract. As a concrete example: Erik Gustafsson had a GAR value of 10.10 and an AAV of $1,200,000 in 2018-2019.
10.10/$1,200,000 = 8.42 GAR/million dollars
In other words, Gustafsson produced at a rate of 8.42 goals above average per million dollars in cap hit. This ranks him as one of the best non-ELC contract values last year. The next two visualizations calculates the GAR/$ value of each defensemen, as defined above by dividing their GAR by their respective cap hit in 2018-2019.
This following graph is an aggregate of all defensemen GAR/$ per team:

As you can see from the graph above, the Ottawa Senators and Tampa Bay Lightning had the largest positive GAR value scores of any team. The Senators achieved this feat with massive value from Chabot, Demelo and Wolanin, with their remaining defensemen enumerating the largest negative scores of any team. This is a promising sign of long-term stability for the defensive unit, but it necessitates building around these three players and augmenting them with better quality. On the other hand, the Lightning boasted the best overall GAR score for defensemen with no negative GAR scores from any defensemen that played 200+ minutes.
The next chart also tracks player value by team, but does so on an individual level that also takes into account time on ice, indicated by the shading of the marker (with blue hues illustrating more TOI and red less TOI):

This chart really accentuates the contributions of Chabot, McAvoy, Gustaffsson and Heiskanen, who all played an average of 22+ minutes per night and posted >8 GAR/million. It also calls into question the deployment of other players who were significantly in the negative but were given substantial ice time. Just to note a few: Engelland, Bouwmeester and Pionk averaged over 19 minutes per night, yet generated GAR values larger than -2.5/million.
The last chart fleshes out this relationship even further by looking at the GAR/minute values relative to their respective cap hit.

When isolating the relationship of GAR/minute and cap hit, the narrative somewhat changes. All of the ELC defensemen were outshined by the likes of Karlsson, Gunnarsson, Beaulieu and Hedman. I for one was surprised to see Carl Gunnarsson as the #1 defensemen in GAR/Minute. While he only averaged approximately 16 minutes per night, he was extremely efficient during this time. It is also important to note that he earned $2.9 million last year, but actually took a pay decrease and re-signed with the Blues for $1.75 million/year for the next two seasons. If he continues to perform at this level next season, he will undoubtedly be a steal.
Additionally, it also begs the question if some players should be utilized more next season. Haydn Fleury, for instance, was in the top-10 in GAR/minute, while only playing 12.5 minutes per night. It remains to be seen if his GAR value could have been inflated by limited ice time and quality of competition, but definitely worth keeping an eye on in the future.
The next installment of the series will look at forwards. Until then, be sure to check out all of the player and team charts that I created here.
