I debuted the Annual Rate Charts (ARCs) on twitter over a month ago and since I’m unleashing the Tableau to the public, I wanted to ensure proper documentation was available.
You can find the link to the interactive Tableau Charts HERE!
What are Annual Rates Charts?
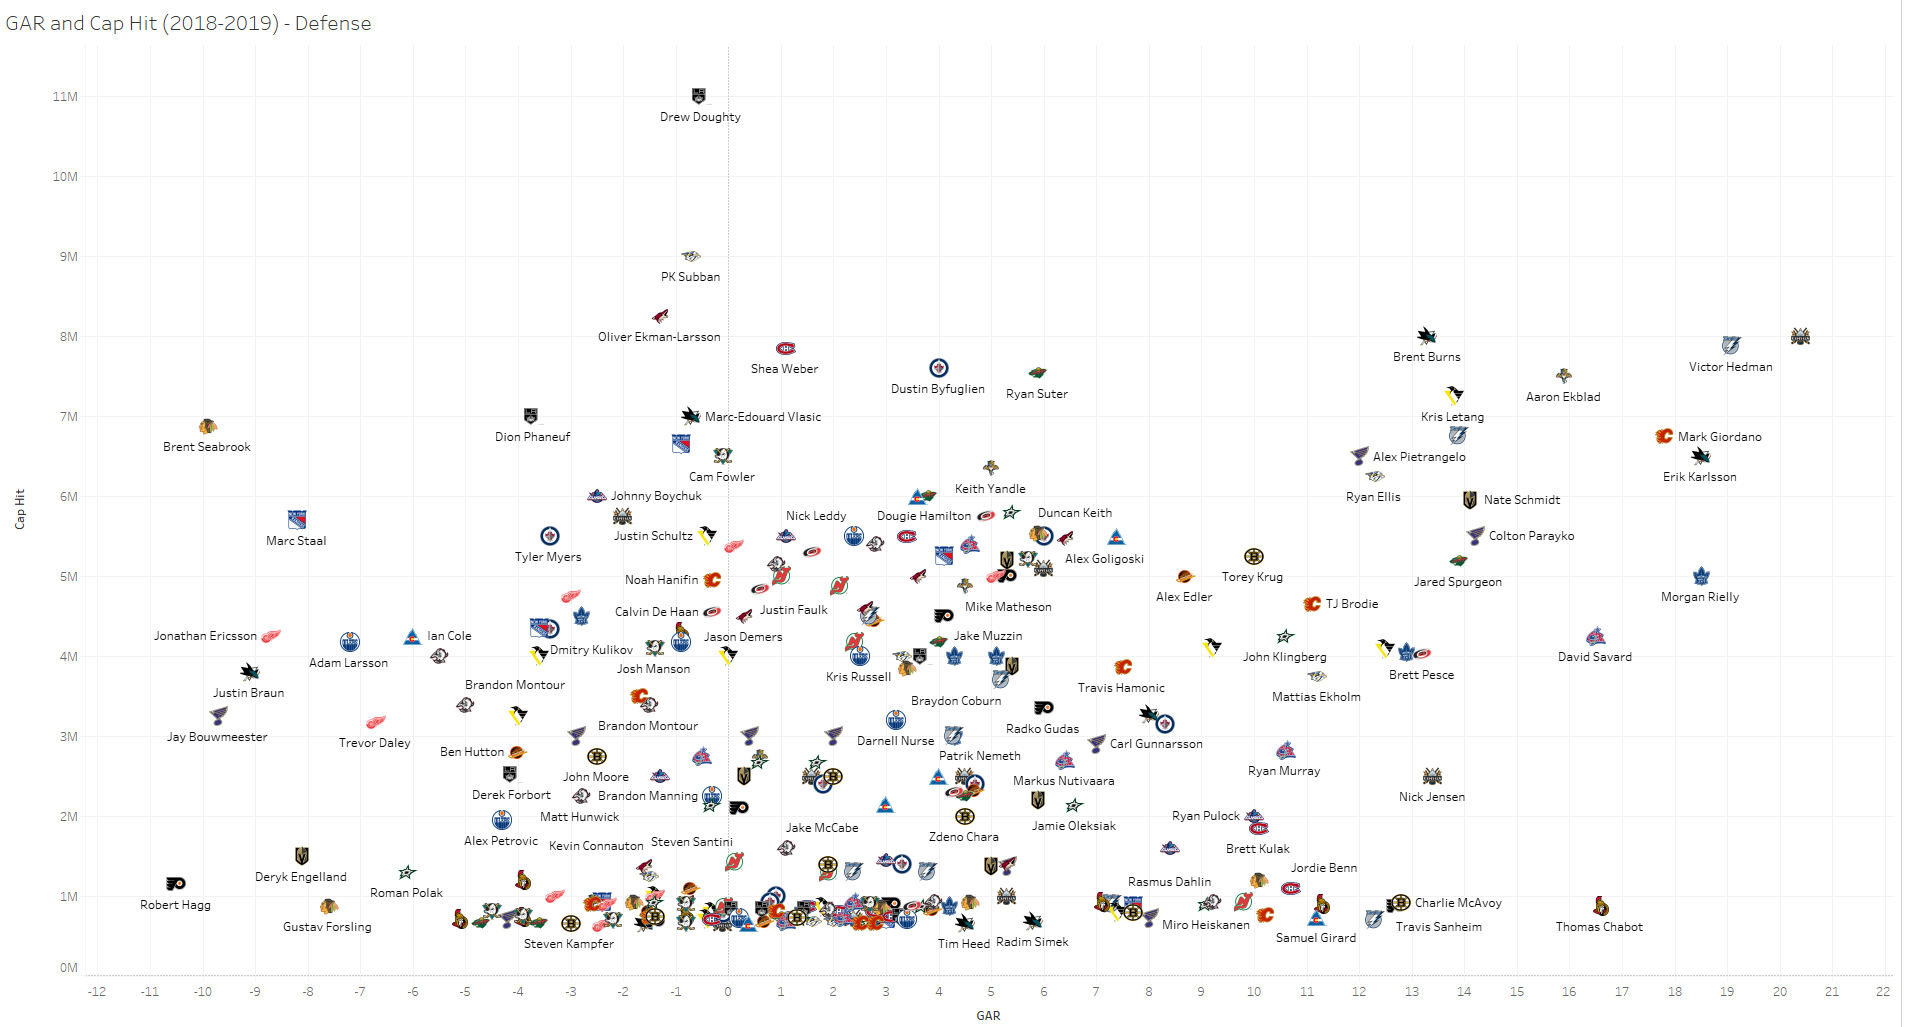
Annual Rate Charts (ARCs) are a way to measure the production and expected production of a player relative to their time on the ice. Production is quantified using the Goals Above Replacement (GAR) and Expected Goals Above Replacement (xGAR) models from Evolving-Hockey. If you want an in-depth analysis of how GAR is calculated, documentation is available here. In short, GAR is a single number that captures the contribution of that player in different game situations. GAR is subdivided into several categories, including even strength offense & defense, power play, penalty kill, takeaways and faceoffs. The number for each player represents the number of goals more (positive) or less (negative) that a player contributions relative to a replacement-level player (by position).
Expected GAR (xGAR) is also a single number assigned to each player, which is calculated based on the on-ice performance of a player (including rates, quality, shooting and goaltending). This number is the expected number of goals more or less above replacement-level that the player should contribute, based on their on-ice actions. In other words, xGAR represents the performance of a player, while GAR represents the results of that performance. When I tested the relationship between these values, I find that xGAR captures approximately 86% of the variation in GAR, which is quite substantial for a model including human subjects.
Annual Rate Charts (ARCs) can be differentiated from many other publicly available visualizations using GAR and xGAR data as it is relative to the amount of time a player is on the ice. These rates can be differentiated from many other popular visualizations that display GAR data in aggregate form. There are strengths and weaknesses to both rate and aggregate data, but both are useful in their own way.